이 글은 책 [UX/UI의 10가지 심리학 법칙 | 사용자의 마음을 읽는 인간 중심 제품과 서비스 디자인]을 공부하며 정리한 글입니다. 자세한 사항은 다음 링크를 참고해주세요.
http://www.yes24.com/Product/Goods/92426632
개요
- 컴퓨터와 사용자가 서로를 기다리지 않아도 되는 속도 (0.4초 이하)로 인터랙션 하면 생산성은 급격히 높아진다
- 사용자의 주의가 분산되는 것을 막는 동시에 생산성도 향상시키려면 시스템 피드백을 0.4초 이내에 제공하라.
- 반응 시간을 개선하고 체감 대기 시간을 줄이려면 체감 성능을 활용하라
- 애니메이션은 로딩이나 프로세싱이 진행되는 동안 사람들의 시선을 끄는 한 가지 방법이다
- 설사 정확하지 않다고 해도 진행 표시줄을 보여주면 사용자는 대기 시간에 더 관대해진다
- 실제 작업이 훨씬 빨리 완료되더라도, 의도적으로 작업 완료를 늦게 알리면 체감 가치를 높이고 신뢰를 형성하는 데 도움이 되기도 한다
기원
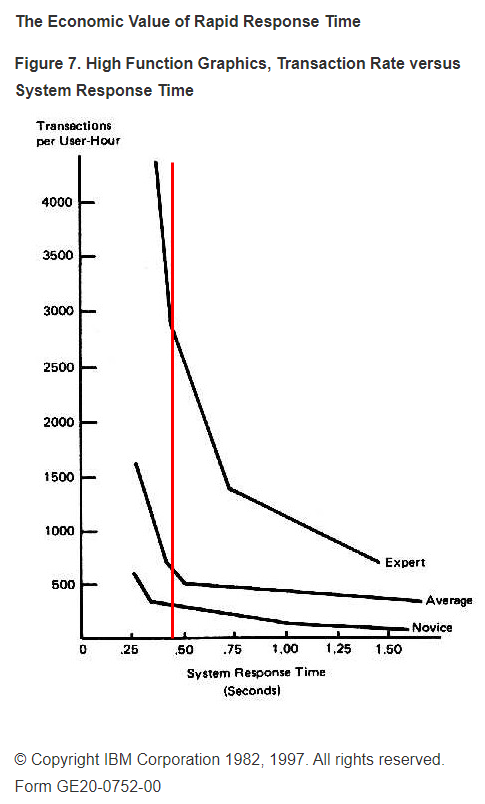
PC가 등장한 초창기에는 PC가 작업을 수행하는 반응 시간의 임계값이 2초로 여겨졌다. 당시에는 이를 사용자가 그다음 작업에 대해 생각할 시간으로 쓸 수 있다고 간주되어 널리 표준으로 받아들여졌다. 하지만 1982년 IBM 직원 2명은 반응 시간이 0.4초 이하일 때 “생산성은 반응 시간 감소의 정비례 이상으로 증가한다”고 명시한 한 편의 논문을 발표하며 이러한 표준에 이의를 제기했다.
존 야블론스키, 『UX/UI의 10가지 심리학 법칙』, 이미령 옮김, 책만(2020), p129.
Original Source : Doherty, Walter J., and Arvind J. Thadhani. "The economic value of rapid response time." IBM Report (1982). https://jlelliotton.blogspot.com/p/the-economic-value-of-rapid-response.html
The Economic Value of Rapid Response Time
This paper was published in November, 1982 and was written by Walter J. Doherty, Manager of Systems Performance and Technology Transfer for...
jlelliotton.blogspot.com
상기 링크 상이 현재 원문으로 알려져있으며, 실제 논문은 PDF 형태로 찾아볼 수 없습니다. 따라서 책 저자의 주장대로 반응 시간이 0.4초 이하일 때 생산성이 정비례 이상의 상승 효과를 얻었다는 주장은 확인하기 어렵습니다. 다만, 반응 시간의 감소에 따라 생산성이 향상된다는 주장을 담고 있는 논문임은 맞습니다. 그리고 논문의 그림들을 통해 시스템 반응 시간의 400ms가 기울기가 급격히 변화하는 지점 부근이라고 추정해볼 수 있습니다.
해외의 반응도 마찬가지입니다. 400ms에 대한 가장 유명한 기원은 미디어에서 찾아볼 수 있습니다.
Only quantifies productivity due to faster response times - no 400ms threshold?
I read through it too, nothing about a 400ms threshold.
Would be interesting to know the real end user threshold of acceptable user. I know google did something with the time it takes to load a youtube video.
The 400ms thing comes from the episode of "Halt And Catch Fire" where I first heard about the so-called Doherty Threshold. Popular Mechanics has a partial writeup of this over here:
http://www.popularmechanics.com/technology/digital/fact-vs-fiction/halt-and-catch-fire-crisis-at-cardiff-16920736
Presumably either the 400ms number was synthesized by the writers, or perhaps one of the other papers cited in the linked article offers up a reasoning behind this number.
https://www.reddit.com/r/programming/comments/2bar4m/til_about_the_doherty_threshold_400ms_response/
"When engineers measure the speed of a PC, they talk about something called the Doherty threshold of system response time," he says. "When you ask your computer to do something and hit the ENTER key, if it answers you back in less than 400 milliseconds, just under half a second, then you will stay glued to that machine for hours. Your eyes may glaze over, but your productivity will soar. Even a slight variation back to half-second response time will allow your attention to stray. But under 400 milliseconds, that's the sweet spot. Our soon-to-be Cardiff PC, though it looks ragtag now, just clocked in at 396 milliseconds. Once assembled, it will not only be faster than all the other PCs on the market, it will also be addictive."
Doherty Threshold - value of rapid response time - Halt and Catch Fire, Season 1, Episode 4
https://www.youtube.com/watch?v=33yx3xGW1FE
https://www.popularmechanics.com/culture/tv/a10796/halt-and-catch-fire-crisis-at-cardiff-16920736/
사례
도허티 임계를 초과할 경우 처리 시간에 대한 피드백을 주기
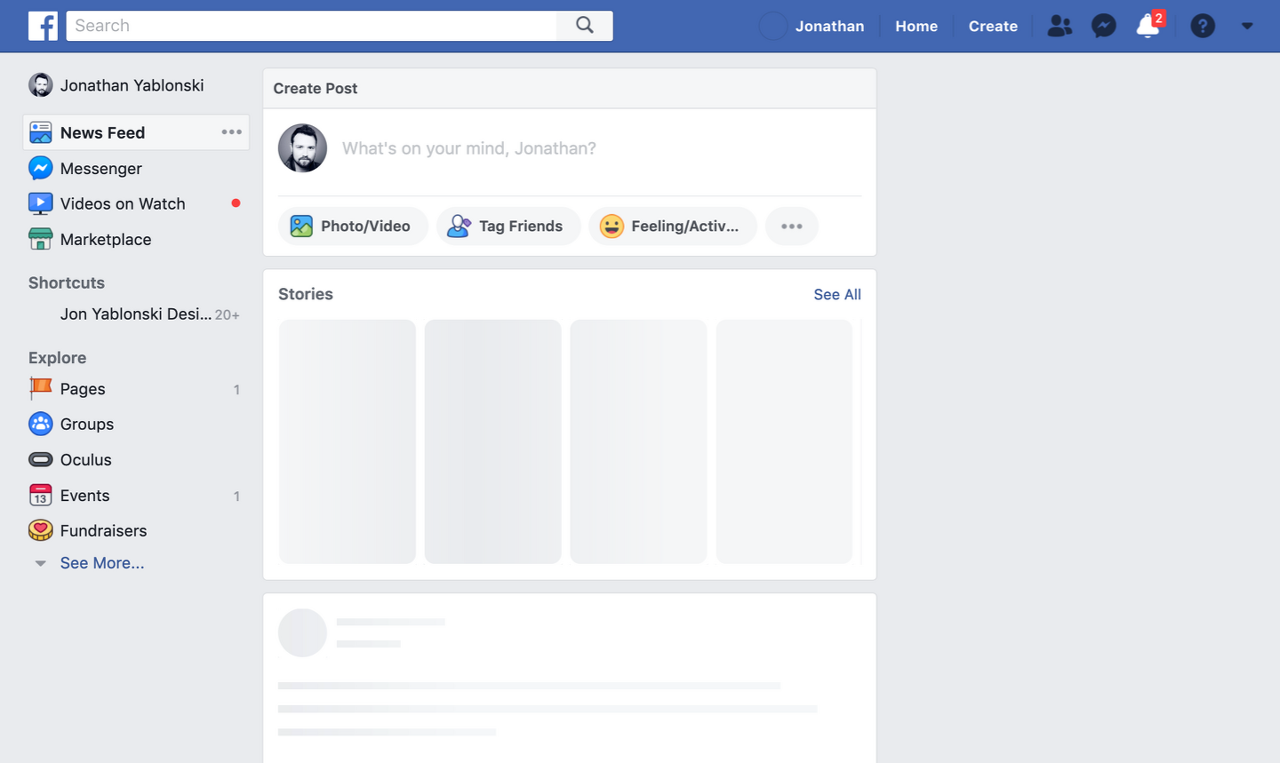
페이스북은 스켈레톤 화면(뼈대 화면)을 제공하여 기다린다는 느낌을 감소시키고 더 빠르게 로딩된다는 착각을 유도한다.
로딩 시간을 최적화하는 블러-업 기법
로딩 시간을 길게 하는 고화질 이미지의 문제를 해결해서 빠르게 로딩되며, 이미지 영역을 미리 확보해서 레이아웃도 깨지지 않는 효과를 준다
애니메이션을 통한 체감 대기 시간 감소
볼거리를 제공해 관심을 애니메이션으로 집중 시키고, 요청 작업이 처리된다는 느낌을 부여한다
사람들은 대기 시간이 10초가 넘어가면 딴 짓을 하고 싶어한다

낙관적 UI로 체감 성능 개선하기
실제 작업이 완료되기 전에 완료되었다고 가정하고 즉각적인 시각적 피드백을 제공한다
작업이 실패했을 때만 오류 메시지를 보여준다
심화 학습
반응이 지나치게 빠른 상황에도 대비할 필요가 있다. 시스템이 사용자의 기대보다 너무 빠르게 반응할 때도 문제는 발생하기 때문이다.
1. 첫째, 변화가 너무 빨리 일어나면 아예 눈치조차 채지 못할 수 있다. 사용자가 요청한 결과가 아니라 자동으로 일어난 변화라면 특히 이런 문제를 일으킬 가능성이 더 크다.
2. 두 번째, 반응이 너무 빠르면, 정신적으로 처리할 시간이 충분히 확보되지 않기 때문에 무슨 일이 일어난 건지 사용자가 이해하기 어려울 수도 있다.
3. 마지막으로, 반응 시간이 사용자의 기대와 달리 너무 빠를 경우, 오히려 신뢰도가 떨어질 수도 있다. 실제 작업이 훨씬 빨리 완료되더라도 의도적으로 완료를 늦게 알리는 것이 체감 가치를 높이고 신뢰를 형성하는 데 도움이 되기도 한다.
존 야블론스키, 『UX/UI의 10가지 심리학 법칙』, 이미령 옮김, 책만(2020), p135.
페이스북의 보안 점검 프로세스는, 점검이 보다 철저히 이루어진다는 신뢰를 줄 뿐만 아니라, 사용자를 교육하는 시간으로 대기 시간을 활용하기 위해 더 긴 시간을 투자한다.
더 나아가기
시스템 대기 시간과 사용자 생산성을 다룬 다른 자료 찾아보기
System response time effects on user productivity
GALE L. MARTIN &KENNETH G. CORL
Pages 3-13 | Published online: 07 Mar 2007
http://lps3.doi.org.libproxy.snu.ac.kr/10.1080/01449298608914494
The present study tested the proposal that reducing computer system response times from a few seconds to sub-second levels results in dramatic increases in user productivity. Subjects completed data-entry and problem-solving tasks using a computer statistical package, under a range of computer response times from 0⋅1 to 5 seconds. Results indicated that some increase in productivity does occur as system response time decreases; however, (1) the size of the effect is considerably smaller than previously indicated, (2) the effect occurred only for data-entry tasks, disappearing in problem-solving situations and declining in strength as the data-entry task became more complex, and (3) the relationship between response time and productivity was linear rather than exponential, as was indicated previously. These results suggest that an attentional automatic processing model of the user is more appropriate than a model proposing that users do not need time to think between entries to the computer.
Marissa Mayer at Web 2.0
Greg Linden (@amazon) 2006.11.09.
http://glinden.blogspot.com/2006/11/marissa-mayer-at-web-20.html
https://www.gigaspaces.com/blog/amazon-found-every-100ms-of-latency-cost-them-1-in-sales
So, Marissa ran an experiment where Google increased the number of search results to thirty. Traffic and revenue from Google searchers in the experimental group dropped by 20%. After a bit of looking, Marissa explained that they found an uncontrolled variable. The page with 10 results took .4 seconds to generate. The page with 30 results took .9 seconds. Half a second delay caused a 20% drop in traffic. Half a second delay killed user satisfaction.
This conclusion may be surprising -- people notice a half second delay? -- but we had a similar experience at Amazon.com. In A/B tests, we tried delaying the page in increments of 100 milliseconds and found that even very small delays would result in substantial and costly drops in revenue.
체감 대기 시간을 줄이는 애니메이션에 대한 논문 찾아보기
Effect of Loading Symbol of Online Video on Perception of Waiting Time
Woojoo Kim, Shuping Xiong & Zhuoqian Liang
Pages 1001-1009 | Accepted author version posted online: 10 Mar 2017, Published online: 29 Mar 2017
http://lps3.doi.org.libproxy.snu.ac.kr/10.1080/10447318.2017.1305051
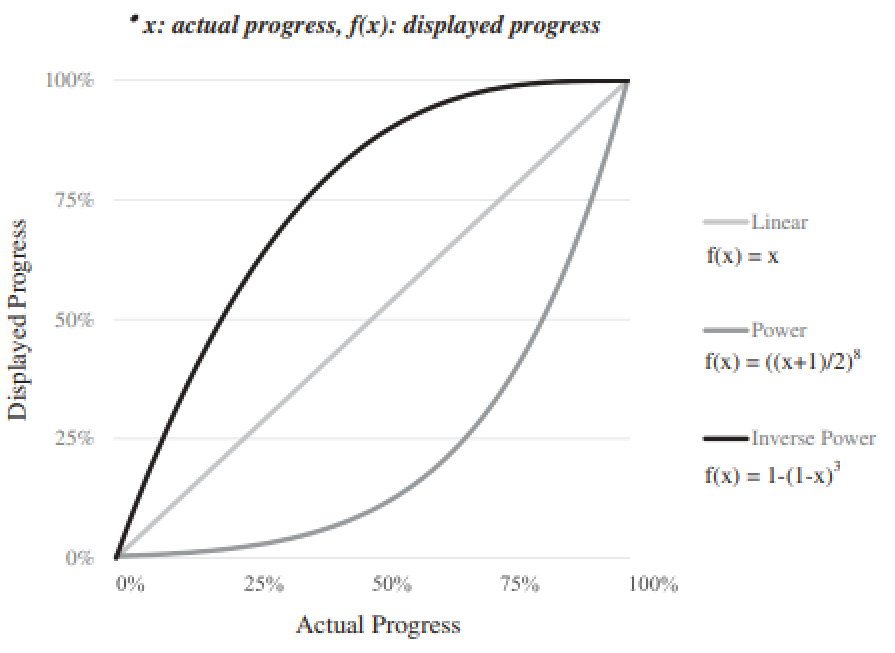
The aim of this study was to investigate the effect of different loading symbols and loading durations on online video viewers’ perception of waiting time. Sixty young adults participated in this study and their subjective ratings on waiting time perception for forty-eight different loading symbols (4 progress functions × 2 shapes × 2 embellishments × 3 durations) were obtained through a 7-point Likert scale. Each participant chose the best loading symbols in terms of waiting time perception at the end of the experiment. Results showed that duration and the progress function practically affect the viewers’ waiting time perception, and shape and embellishment do not. Loading symbols of power and inverse power progress functions are perceived as shorter than those of the repetitive and linear progress functions. It is recommended to show loading progress and use manipulated progress functions, and design factors such as shape and embellishment are considered to be less important for designing a better loading symbol. The findings of this study may serve as a useful input for video service providers and symbol designers in creating shortly perceived loading symbols.

터미널 기준의 도허티 임계가 아닌 현재의 UIUX에 대하여
Paul Buchheit, Gmail과 Google AdSense를 만든 개발자 : 100ms가 새로운 임계값
"The creator of Gmail, Paul Buchheit, had a rule: every interaction should be faster than 100ms. Why? Because 100ms is the threshold where interactions feel instantaneous"
Source Undefined
Applied Sciences Group: High Performance Touch : 터치에서는 10ms, 1ms까지
Microsoft Research, 2012.03.07.
Modern touch devices allow one to interact with virtual objects. However, there is a substantial delay between when a finger moves and the display responds. Microsoft researchers, Albert Ng and Paul Dietz, have built a laboratory test system that allows us to experience the impact of different latencies on the user experience. The results help us to understand how far we still have to go in improving touch performance.
100ms의 반응 속도는 소비자 경험만을 위한 속도가 아니다
Google: Try For A Few 100MS For Time Spent Downloading A Page Metric
John Mueller, Senior Webmaster Trends Analyst Tweeted in 2018.09.11.
https://www.seroundtable.com/google-100ms-time-spent-downloading-26358.html
Google: Try For A Few 100MS For Time Spent Downloading A Page Metric
Google's John Mueller hinted that you should aim for your
www.seroundtable.com
We don't have any hard guidelines on this, but anecdotally I see sites with a few 100ms time to fetch resources (some with <100ms), and other sites with way over 1000ms. Faster usually lets us crawl more, should we need it (crawling is just a small piece of the picture though).
— 🦝 John (personal) 🦝 (@JohnMu) September 11, 2018
You can see this stat by going to the old Google Search Console crawl stats section.
주의 : 도허티 임계 상의 수치는 SRT(System Response Time)인 반면 크롤링 측면에서의 구글 권고 100ms는 다운로드에 걸리는 시간을 의미하는 것입니다.
Merlinox : “John recommends that the average response time in GSC crawl stats should be around 100ms.“
John : “We don't have any hard guidelines on this, but anecdotally I see sites with a few 100ms time to fetch resources (some with <100ms), and other sites with way over 1000ms. Faster usually lets us crawl more, should we need it (crawling is just a small piece of the picture though).”
Merlinox : “I'm obviously totally cool with you, but I never see some pages with less than 100 ms of "time spent downloading a page": you don't speak about FTTB, but download time, right?”
John : “Yeah, that's the stat shown in search console. This is not about rendering / user-experience (though that's important too), it's really just about crawling for search. The two sides are significantly different, and often mixed up.”
Appendix
- https://jlelliotton.blogspot.com/p/the-economic-value-of-rapid-response.html
- https://brunch.co.kr/@yeon-kim/13
- https://lawsofux.com/doherty-threshold/
- https://www.flashover.blog/posts/dohertys-threshold-is-a-lie
- https://www.reddit.com/r/programming/comments/2bar4m/til_about_the_doherty_threshold_400ms_response/
- https://www.youtube.com/watch?v=vOvQCPLkPt4
- https://www.popularmechanics.com/culture/tv/a10796/halt-and-catch-fire-crisis-at-cardiff-16920736/
- https://perspectives.mvdirona.com/2009/10/the-cost-of-latency/
- http://glinden.blogspot.com/2006/11/marissa-mayer-at-web-20.html
- https://kottke.org/09/12/google-dns
- https://daverupert.com/2015/06/doherty-threshold/
- https://ebookreading.net/view/book/EB9781492055303_12.html
- MARTIN, G. L. and CORL, K. G. 1986. System response time effects on user productivity. Behaviour and Information Technology, 5: 3–13.
- Kim, W., Xiong, S., & Liang, Z. (2017). Effect of loading symbol of online video on perception of waiting time. International Journal of Human–Computer Interaction, 1–9.
'기술 공부 > 일반 트렌드' 카테고리의 다른 글
| A/B 테스팅으로 개선 결과 검증 (0) | 2022.04.04 |
|---|---|
| DevOps (3) | GitHub Repo Migration (0) | 2022.04.04 |
| DevOps (2) | ALB, NLB, AWS Load Balancer Controller (0) | 2022.03.26 |
| DevOps (1) | CI와 Github Action (0) | 2022.02.08 |
| 전기차를 넘어선 전기 이동수단 | Moonbikes, Xubaka, Brekr (0) | 2022.01.05 |